No one is a stranger to how important data is for an organization in the 21st century. But how one uses their data to their advantage is the key in every competitive industry. The data-driven companies that use integrated and advanced analytics outperform their competitors in every aspect of their business. Whether it be in decision making, building applications or deciding on marketing strategies; analytics has become indispensable for every business.
Here at Discite, we can partner with you in all the three domains of analytics:
Descriptive Analytics: interpretation of historical data to better understand changes that have occurred in a business
Predictive Analytics: uses many techniques from data mining, statistics, modeling, machine learning, and artificial intelligence to analyze current data to make predictions about the future of your business.
Prescriptive Analytics – If descriptive analytics tells you what has happened and predictive analytics tells you what could happen, then prescriptive analytics tells you what should be done. This methodology is the third, final, and most advanced stage in the business analysis process and the one that calls businesses to action, helping executives, managers, and operational employees make the best possible decisions based on the data available to them.
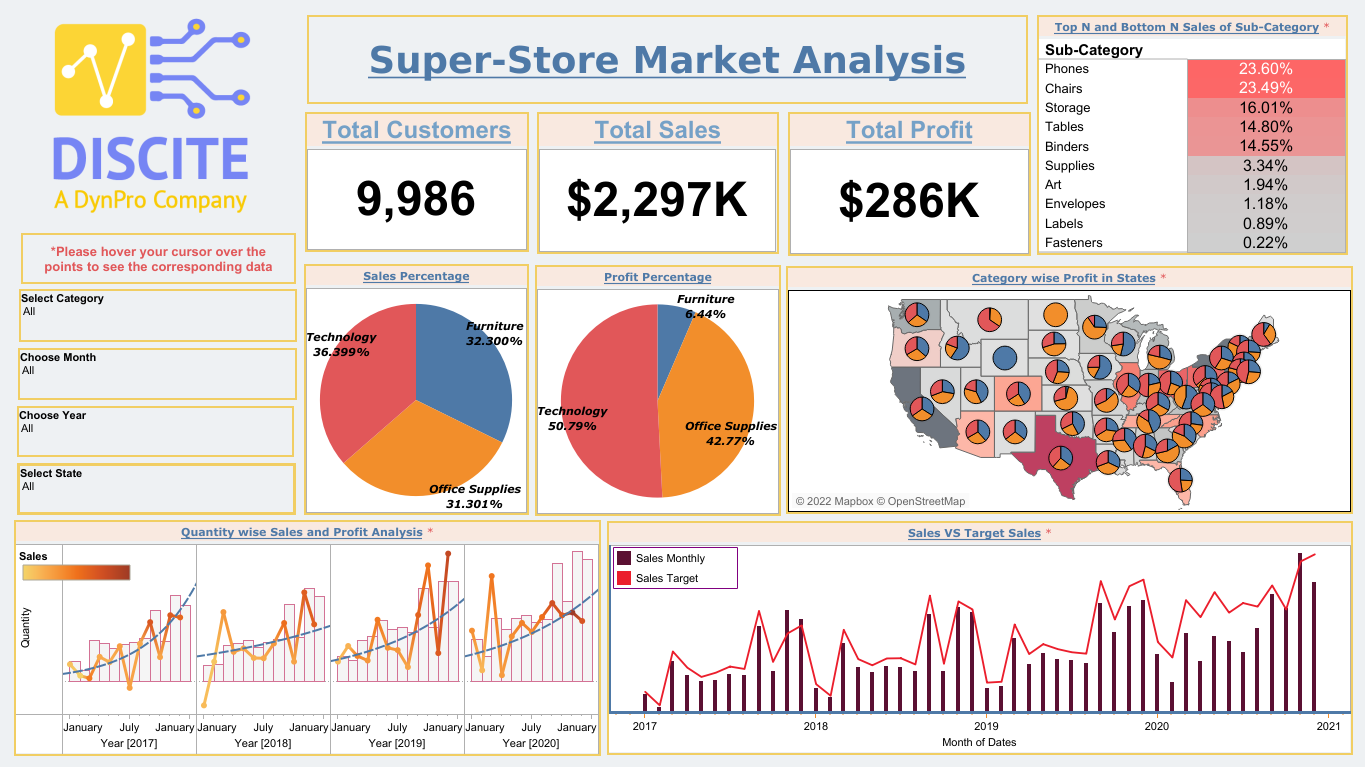
We also build custom dashboards that help you with better insights and decision-making for nearly every department of your organization – operations, finance, marketing, sales, etc.
What are the Advantages of Advanced Analytics & Dashboards?
Better Decision Making
A skilled business analyst with the right software/tools can help companies identify market trends and make educated decisions to increase sales and profits.
Better Insights
Companies can uncover more insights about their customer base by breaking down large sets of data into smaller sets of information that can be used to further understand what their target market may want in terms of products or services they might offer.
Improving Productivity and Revenue Growth:
It help companies understand what ventures are most profitable and which areas need to be expanded further. It also helps to understand how they compare against their competition and what business tactics might work better than others for cost-effectiveness.
Finding errors
Data Analytics and Visualizing your data help quickly identify any errors in the data. If the data tends to suggest the wrong actions, visualizations help identify erroneous data sooner so that it can be removed from the analysis.
Analyze market behavior
Decision-makers can identify opportunities and threats to their business in real-time, thanks to an advanced data analytics dashboard – compare year-on-year sales for example and make the most out of their performance.
Data Relationships
Data Analytics and Visualisation help companies to pinpoint the inter-relationships between data sets with the help of demonstrated facts, which help companies make business decisions based on these findings.
Increase the Quality of your Decision Making
Get Expert consultation for your Data Analytics and Dashboarding requirements